
Link Up: Sharing Reliable, Relevant Content
April 19, 2022
Google My Business Turned Google Business Profile
June 15, 2022Measure, Adjust, Optimize: LinkedIn Analytics for Content Marketing

Your company’s marketing efforts on LinkedIn have the potential to be an extremely valuable tool, but the work doesn’t end as soon as the posts are published. It’s vital to follow up on your content and monitor analytics to decipher which parts of your efforts are working and which have room for improvement. The more closely you pay attention to LinkedIn analytics, the better you can target your audience and verify the effectiveness of your content.
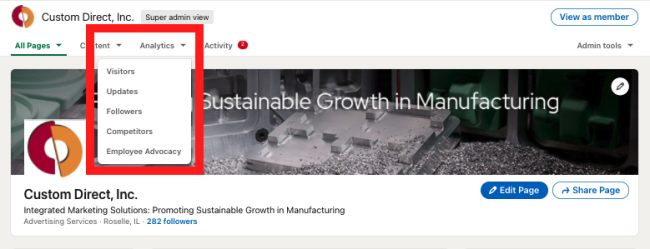
To navigate through your LinkedIn Analytics, you need to be under Admin or Super Admin View on your company account. Directly below your company’s name, you will see a toolbar consisting of All Pages, Content, Analytics, and Activity as seen below. Under the Analytics tab, you will have a dropdown menu including Visitors, Updates, Followers, Competitors, and Employee Advocacy.
LinkedIn Analytics offers a wide range of metrics to help your company gauge how successful its marketing efforts have been on the platform. From page visitors to ad interactions, there are endless ways to measure your overall engagement on your company’s LinkedIn page. When it comes to determining the effectiveness of your content, however, analytics directly related to each post published will be particularly useful, which can be found under the “Updates” option. There are three pillars to your post analytics on LinkedIn: Engagements, Discovery, and Impression Demographics.
Engagements let you know the total number of engagements on your post; this includes clicks, likes, comments, and shares. Discovery, on the other hand, gives you details on your posts’ impressions. Impressions are the number of times your post was displayed on a user’s screen for at least three seconds. Engagement and discovery are important analytics to compare and contrast. It’s crucial to analyze how many people are interacting with your post, such as liking, sharing, or commenting on it, in comparison to the amount of people your post is actually put in front of. The closer those numbers are to one another, the more likely it is that you are successfully reaching your target market. You can also determine how close you are to hitting your desired audience by reviewing your Impression Demographics. Additional analytics include article and video performance metrics.
To get started on LinkedIn, connect with our team now.